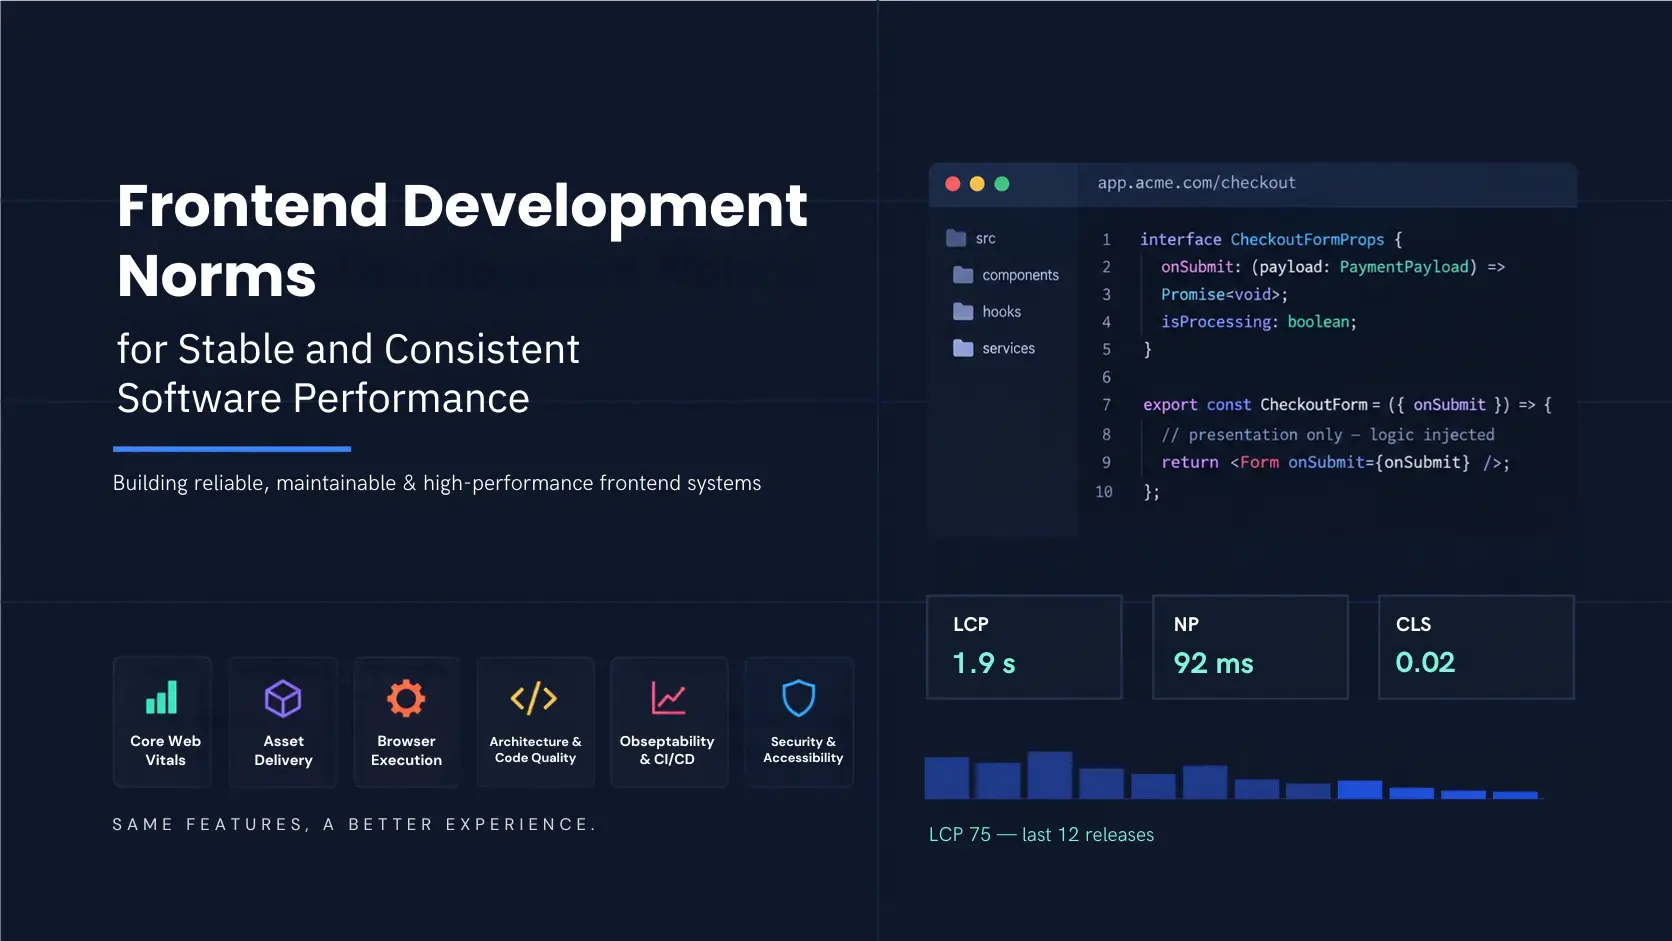
Six Pillars of a Stable, Consistent Frontend
Most frontend problems are not bugs. Nothing throws, nothing fails a test, and every ticket closes green. The application just gets slower, heavier and harder to change — one reasonable decision at a time, none of which anybody wrote down.
The fix is not more discipline. It is a written standard that a machine can check. Here is the framework we use, organised as six pillars.
Why "it works" is not a standard
Consider two releases of the same product page. Both ship the same features. Both pass every functional test. In the first, an unoptimised hero image loads late and pushes the product title down the page while the user is reading it, and a click on "Add to cart" is met with 400 milliseconds of blocked main thread. In the second, the image has reserved space and the click handler yields.
No error was logged in either release. The difference is entirely in what the user experienced — and that is exactly the kind of quality that disappears unless somebody measures it on purpose.
The six pillars
Each pillar covers a different point in the journey from your repository to the user’s screen.
- 01 · Core Web Vitals — what the user actually feels: how fast the page appears, how quickly it answers, whether it stays still.
- 02 · Asset delivery — what the browser has to download before it can do anything useful: bundle size, code splitting, images, fonts, compression, caching.
- 03 · Browser execution — what happens after download: main-thread work, long tasks, rendering cost, virtualisation.
- 04 · Architecture and code quality — whether the codebase still holds after the next twenty features: type safety, module boundaries, dependency hygiene.
- 05 · Observability — what users actually received, measured in the field rather than on a developer laptop.
- 06 · CI/CD governance — the pillar that turns the other five from good intentions into checks that cannot be skipped.
Drop any one and the rest stop being reliable. A team can hit every Core Web Vitals target in a lab audit, ship a 900 KB bundle, and never find out — because there is no field monitoring and no budget gate.
Security and accessibility are not a seventh pillar
They belong to every one of the six. Escaping output is an architecture concern. Dependency scanning is an asset-delivery concern. Keyboard operability is a rendering concern. Both are verified inside the pillars — at code review, in the pipeline, and in the field — rather than bolted on at the end as a separate audit.
Be honest about where the numbers come from
Some of the targets in a standard like this are published by an external body, and some are your team’s own opinion. Mixing the two is the fastest way to lose a technical audience.
| Target | Where it comes from |
|---|---|
| LCP ≤ 2.5 s · INP ≤ 200 ms · CLS < 0.1 | Published by Google (Core Web Vitals) |
| WCAG 2.2 level AA | Published by the W3C |
| OWASP ASVS 5.0 | Published by OWASP |
| Route bundle ≤ 170 KB gzipped | Team-agreed proposal |
| No main-thread task over 50 ms | Team-agreed proposal |
| Virtualise lists beyond ~100 rows | Team-agreed proposal |
Say which is which out loud. A proposal you can defend is stronger than a standard you misattributed.
How to start without a rewrite
- Standardize. Write the six pillars and their targets into a file in the repository, not a wiki page. Version it, change it by pull request.
- Automate. Take the lint and type-check jobs you already run and mark them required. No new code, and it establishes the precedent that a check is allowed to block a merge.
- Measure. Stand up real-user monitoring so performance conversations stop being anecdotal.
The Takeaway: Frontend quality is not a project with an end date. It is a system you maintain — and systems are cheaper than heroics.
Sources: web.dev/articles/vitals · developer.mozilla.org/en-US/docs/Web/Performance · ISO/IEC 25010:2023 · owasp.org · w3.org/TR/WCAG22
What LCP, INP and CLS Actually Mean
Core Web Vitals get quoted in standups long before anybody explains them. They are three metrics, and each one answers a simple question about a single page.
- LCP — did it appear?
- INP — did it answer?
- CLS — did it stay still?
That is the whole idea. The detail below is worth ten minutes because these are the same three numbers every team in the industry is using, which makes them comparable, arguable and hard to hand-wave.
LCP — Largest Contentful Paint
LCP measures how long it takes for the largest element in the viewport to finish painting. Usually that is a hero image, a video poster or a block of headline text.
It is deliberately not "when the page started loading" or "when everything finished". It is the moment the biggest visible thing is actually there, because that is the moment a page stops feeling empty.
Why it is useful: LCP is the clearest available proxy for "this feels slow", and because it usually resolves to one element, it usually resolves to one fix. The common causes are a render-blocking script, an image with no preload hint, or a slow server response.
<!-- tell the browser about the LCP image early -->
<link rel="preload" as="image" href="/hero.avif" fetchpriority="high">

<!-- and never lazy-load the element that IS the LCP -->
<img src="/hero.avif" width="1200" height="600" alt="...">
INP — Interaction to Next Paint
INP measures how long it takes from a tap, click or keypress until the browser paints the visual response. A single interaction has three phases: the input delay before your handler can run, the handler itself, and the time to present the result.
The important detail is that INP counts all three. Its predecessor, First Input Delay, measured only the first phase — which is why applications could score well and still feel unresponsive. INP replaced FID as a Core Web Vital in March 2024.
Why it is useful: a poor INP is the reason users click a button twice. That is not a cosmetic complaint — on a checkout flow it produces duplicate orders.
CLS — Cumulative Layout Shift
CLS measures how much visible content moves unexpectedly while the page is loading. The score combines how far something moved with how much of the screen it affected, which is why it is a unitless number rather than a measurement in seconds or pixels.
Why it is useful: layout shift is the invisible defect. Nothing errors, nothing fails a test, and a screenshot looks perfect. It is also the leading cause of mis-taps — an ad or a late-loading banner pushes the page down, and the user’s finger lands on the wrong thing.
The usual culprits are images and iframes without width and height attributes, content injected above existing content, and web fonts that reflow text when they swap in.
The thresholds
Google publishes three bands for each metric.
| Metric | Good | Needs improvement | Poor |
|---|---|---|---|
| LCP | ≤ 2.5 s | 2.5 – 4.0 s | > 4.0 s |
| INP | ≤ 200 ms | 200 – 500 ms | > 500 ms |
| CLS | ≤ 0.1 | 0.1 – 0.25 | > 0.25 |
How they are measured — and why that matters
All three are assessed at the 75th percentile of real user visits. That means they describe the experience of the slower three-quarters of your users, not the average, and not the fast laptop the build was tested on.
This is why a green Lighthouse score and a failing Core Web Vitals report are not a contradiction. Lighthouse tells you what the build is capable of on one machine. Field data tells you what people actually got, on a mid-range phone, on a weak connection, with three browser extensions installed. You need both.
Two practical rules follow. Report per route, because a site-wide average hides every specific problem you could act on. And tag by release, because "it got slower" is only actionable when you know which deploy did it.
The Takeaway: These are recommended targets, not guarantees and not a ranking promise. Their value is that they are measured on the user’s device rather than yours.
Sources: web.dev/articles/vitals (Google)
Your Bundle Size Is a Product Decision
Here is a mistake that takes one line to make. A dashboard imports a charting library at the top of a shared file. The bundler does what it is told, and the charting engine ends up in the entry bundle. Now every first-time visitor downloads it — including the 88% who never open a chart.
A realistic version of that shape: 1.2 MB of initial JavaScript, of which roughly 120 KB is the application core and the rest is charts, tables and modal content that most sessions never touch.
Split by route first
Route-level code splitting is the highest-value change available, and in a modern framework it is a two-line edit.
const Analytics = lazy(() => import('./routes/Analytics'));

// The 45 KB charting chunk is requested only when the user
// navigates to /analytics — not by everyone, on every visit.
The same application then ships around 120 KB to first paint, and the heavy feature arrives on the route that needs it. Same functionality, roughly a tenth of the entry cost.
Beyond JavaScript
JavaScript gets the attention, but the rest of the payload is usually easier to fix.
- Images — serve modern formats such as AVIF or WebP, size them for the layout rather than shipping a 4000 px original, and always set width and height so the browser can reserve space.
- Fonts — subset to the characters you use, preload the one font that appears above the fold, and set font-display so text is never invisible while waiting.
- Compression — serve every text asset with Brotli in preference to gzip. This is a server configuration change, not a code change.
- Caching — give static assets a content hash in the filename and a long, immutable cache lifetime. The hash makes that safe: a changed file is a different URL.
A budget only counts if it fails the build
Write a byte budget per route, keep it in the repository, and wire it into continuous integration so that exceeding it fails the pipeline.
A budget that only prints a warning is not a budget — it is a log message that scrolls past. The whole value of the number is that it forces a conversation on the pull request that introduced the regression, rather than six months later when nobody remembers which change caused it.
One honest note: figures like "170 KB gzipped per route" are widely used starting points, not published standards. Expect the number to differ between a marketing landing page and an internal data grid. What matters is that a number exists, lives in version control, and blocks a merge when it is breached.
The Takeaway: Every kilobyte you ship is paid for by the user — on their device, on their network, on every visit.
Sources: developer.mozilla.org/en-US/docs/Web/Performance · web.dev
The Main Thread Is the Bottleneck
Downloading your code is half the cost. Running it is the other half, and a small bundle that blocks the main thread for 400 milliseconds is still a slow application.
The browser has one thread for your user interface. Layout, painting, event handlers and most of your JavaScript all take turns on it. While it is busy, nothing scrolls, nothing types, and nothing responds.
The 50 ms rule
The browser can only answer input between tasks. A single task that runs for 400 ms means up to 400 ms of dead interface — the click registers, nothing paints, so the user clicks again.
The working rule is that no single main-thread task should exceed roughly 50 milliseconds on a critical path. Breaking one long function into smaller chunks and yielding between them does not make the total work any faster; it gives the browser gaps in which to respond, which is what the user actually perceives.
Virtualise long lists
Rendering ten thousand table rows produces ten thousand DOM nodes, enormous layout recalculation, and a browser that freezes for seconds when you filter.
Virtualisation renders only what is on screen — about twenty rows — whether the dataset is ten thousand rows or ten million. Libraries such as TanStack Virtual and react-window handle the windowing for you.
This failure is worth calling out because it never appears in testing. The test fixture has twenty rows. It is perfect in a demo and unusable for the one enterprise customer with real data.
Move heavy work off the thread
Sorting, filtering, parsing and transforming large datasets do not need to touch the UI thread at all.
const worker = new Worker('./filter.worker.ts');

worker.postMessage({ rows, query });
worker.onmessage = (e) => setVisibleRows(e.data);

// The interface stays responsive while the work happens.
How to find these in practice
- Record a performance trace in Chrome DevTools while performing the slow interaction. Long tasks are flagged with a red marker in the timeline.
- Use your framework profiler to find components re-rendering when nothing they depend on changed.
- Check INP attribution in your real-user monitoring — it will tell you which interactions are slow for actual users, which is not always the one you suspected.
- Memoise expensive computations and debounce costly input handlers before reaching for anything more elaborate.
The Takeaway: Bundle size decides when your code arrives. Main-thread discipline decides whether the interface answers when the user touches it.
Sources: developer.mozilla.org/en-US/docs/Web/Performance
Components Render. They Do Not Decide.
Every codebase has one. A single component that holds the form markup, the validation rules, the state transformations and the API calls — eight hundred lines that three people are quietly afraid to open.
It is not dangerous because it is long. It is dangerous because a CSS change and a payment bug now live in the same blast radius. Adjusting a layout can break form submission, because presentation and business logic share one scope.
Give the component a contract
The fix is not a framework. It is a boundary: the component renders, and the behaviour is injected.
interface CheckoutFormProps {
  onSubmit: (payload: PaymentPayload) => Promise<void>;
  isProcessing: boolean;
}

export const CheckoutForm: React.FC<CheckoutFormProps> = ({
  onSubmit, isProcessing
}) => {
  // Presentation only. Business logic arrives through props and hooks.
};
Read the interface rather than the component. Two props, both typed, and a stated contract: this file renders, it does not decide. Payment logic moves into a hook or a service, and a layout change can no longer reach it.
What strict mode actually buys you
TypeScript’s strict flag enables the full set of strict type-checking options, including no implicit any and strict null checks.
Enabling it on an existing codebase typically surfaces a batch of real null-handling defects on the first day. Those are not new bugs. They are bugs you already shipped that have not been triggered yet, and the compiler is now telling you where they are.
Expect the migration to be uncomfortable and do it anyway — ideally file by file, with the strict flag on and targeted suppressions that you burn down over time.
Rules worth writing down
- Business logic lives outside UI components, in hooks or services.
- Every module has one responsibility and an explicit public interface.
- No magic values. Named constants, or a typed enum.
- Shared lint and format configuration, versioned in the repository and enforced in CI.
- Formatting is never discussed in code review — a formatter settles it, so review can discuss design.
Dependencies are architecture too
Most frontend codebases are, by weight, mostly other people’s code. The only moment a dependency costs nothing is before you adopt it, which makes the review question "are we willing to maintain, patch and eventually migrate off this for the next three years?" rather than "does it work?".
A 40 KB library added for one date-format call is a permanent tax on every user’s download and a permanent entry on your vulnerability watchlist.
The Takeaway: Strict types and clear boundaries turn tomorrow’s runtime crash into today’s compile error.
Sources: typescriptlang.org/tsconfig#strict · eslint.org · prettier.io · ISO/IEC 25010:2023
Lab Scores Describe the Build, Not the User
A release passes every check in continuous integration. Three days later, support reports that the application "feels slow". With no field data, nobody can say which deploy caused it, which routes are affected, or how many users are hitting it.
That gap is why observability is a pillar rather than a footnote.
Lab data and field data are both true
A lab audit runs on a fast machine, a fast network and a clean browser profile. It might report a 1.1 second LCP, and that number is real.
Field data is a mid-range Android on 4G with three extensions installed. The same route might report 2.4 seconds at the 75th percentile. That number is also real — and it is the one describing your product.
Lab data tells you what the build is capable of and is excellent for catching regressions before merge. Field data tells you what users received. Use both, and never let one stand in for the other.
Why the 75th percentile
An average hides the tail, and the tail is where people abandon. Reporting at the 75th percentile means the number describes the slower three-quarters of visits, which is also how Google assesses Core Web Vitals. Aligning your internal reporting to the same percentile avoids a great deal of confusion later.
What to instrument
- Core Web Vitals from real sessions, segmented per route.
- JavaScript errors with rate, stack and the number of users affected.
- Failed API calls — status, endpoint, and the retry behaviour that follows.
- Crash and error rate tagged by release version.
- User-impacting failures, meaning blocked journeys rather than raw log volume.
- Whether a shipped fix actually reached users, which is not the same as having deployed it.
Report per route, tag by release
These two habits do most of the work. A site-wide average conceals every specific problem you could act on, so segment by route. And "it got slower" only becomes a ticket when you can point at the deploy that did it, so tag every metric with a release version.
Then set an alert threshold on regression rather than on an absolute value. You want to know that this release made a route worse, not that a route has been mediocre for a year.
One last note on scale: an error affecting 0.3% of sessions looks like noise in a log. Attributed to one route and one browser version, it is usually a single reproducible bug.
The Takeaway: If you cannot measure quality in production, you cannot claim to maintain it.
Sources: web.dev/articles/vitals — Core Web Vitals are defined for field measurement at the 75th percentile
A Warning Is Not a Quality Gate
You can write the best frontend standard in the industry and have none of it survive a deadline. There is a specific step where standards die, and it is worth naming: the pipeline prints a warning instead of failing.
A warning is a log message. It scrolls past, the pull request goes green, and the regression ships. Governance is the difference between a rule and a suggestion, and the difference is whether a failed check can stop a merge.
The gates
Every pull request should pass the same set of checks, and every one of them should be a required check rather than an advisory one.
| Gate | What it runs |
|---|---|
| Static checks | Type check, lint, format verification |
| Security | Dependency audit, supply-chain scan |
| Tests | Unit, component, and the affected end-to-end suite |
| Budget | Bundle size per route, Core Web Vitals in a lab run |
| Accessibility | Automated rule checks in the component test suite |
| Review | A human reading the design, not the formatting |
Roughly five of those six need no human at all. That is the point — the goal is not more process, it is less reliance on anybody remembering.
Budgets belong in version control
A budget kept in a slide deck or a wiki changes silently, whenever it is inconvenient. A budget kept in the repository changes through a pull request, with a reviewer and a reason attached.
This matters more than it sounds. It turns "we went over budget this sprint" from an invisible drift into an explicit decision that somebody approved, on the record, with the trade-off written down.
Every release needs a way back
A rollback path that has never been executed is a hypothesis, not a plan. Rehearse it. Deploy behind a canary with monitoring attached, and confirm that reverting is a single, tested action rather than an improvised evening.
The cheapest possible first step
If you adopt nothing else from this series, do this: take the lint and type-check jobs your pipeline already runs and mark them as required checks.
It costs no new code and no new tooling. What it buys is the precedent that a gate is allowed to block a merge — and every other gate is a variation on that same move.
The Takeaway: A rule that depends on someone remembering is not a standard. It is a suggestion.
Sources: Gate list composed from Google web.dev, OWASP and W3C guidance; tooling is implementation-specific
The Two Concerns That Touch Every Pillar
Security and accessibility resist being scheduled. They are not a phase, and they are not a pre-launch audit. They appear inside every other decision, which is why they sit underneath the six pillars rather than beside them.
Frontend security is about trust, not obscurity
The common misconception is that frontend security means obfuscating the bundle. It does not. Anything shipped to a browser is readable, and treating that as a defence is how teams end up with an API key in a minified file.
Real frontend security is about boundaries — what the browser is allowed to trust, execute, load and expose.
- Input and output — escape and encode by default. Never render untrusted content as raw HTML.
- Authentication and sessions — short-lived tokens, sensible scope, httpOnly cookies where possible, and never a token in a URL or a log line.
- Browser controls — a Content Security Policy, security headers, SameSite cookies and a correctly narrow CORS configuration.
- Supply chain — lockfiles, provenance checks and an automated dependency audit in the pipeline.
- Detection — security logging and alerting, so that a compromise is something you notice rather than something you are told about.
The single most common stored cross-site-scripting vector in a modern application is one line long:
// Safe — React renders this as text, not markup
<div>{userComment}</div>

// Dangerous — bypasses escaping entirely
<div dangerouslySetInnerHTML={{ __html: userComment }} />
It passes every functional test. Use the OWASP Top 10 for awareness of what to worry about, and OWASP ASVS for requirements you can actually mark pass or fail in a pipeline.
Accessibility is operability
WCAG 2.2 organises accessibility under four principles — perceivable, operable, understandable and robust — with three conformance levels. Most organisations target level AA.
Be careful with the word "compliant". Automated tooling finds missing labels and insufficient contrast, which is roughly a third of the criteria. It cannot tell you whether a flow makes sense to somebody using a screen reader. Level AA is a floor, not proof.
The most common defect shipped in production is a clickable div. It is not focusable, it is not announced as a button, it cannot be operated by keyboard — and it looks completely identical in a screenshot.
<!-- Not operable by keyboard, not announced with a role -->
<div onClick={save}>Save changes</div>

<!-- Focusable, announced, keyboard-activated, free -->
<button type="button" onClick={save}>Save changes</button>
Semantic HTML first. Reach for ARIA only where HTML genuinely cannot express the intent, because incorrect ARIA is worse than none.
The ten-minute test
Put the mouse away and complete one important task in your product using only the keyboard. Check that focus is always visible, that the tab order follows the visual order, and that nothing traps you. Most accessibility defects a team ships are found in that exercise, not in a report.
The Takeaway: Both concerns are verified inside the pillars — at review, in CI and in the field — not bolted on before launch.
Sources: owasp.org/Top10 · owasp.org ASVS 5.0 · w3.org/TR/WCAG22 · developer.mozilla.org/en-US/docs/Web/Security